 |
Multiphase Refinements |
 |
Multiphase Refinements |
Multiphase Refinements
The previous section describing the refinement of the structure of lead sulphate by the Rietveld method talked only in terms of a single structural phase. In fact, the original Rietveld paper described a multiphase approach to structure refinement from powder data, but with one of the phases being a magnetic structure. The extension of this concept to two or more non-magnetic structures is simple enough. That said, it must be emphasised that the best results will always be obtained when the data corresponds to a single phase material: multiphase refinements should not be relied on to compensate for incorrect or sloppy synthesis methods. However, there are cases when multiphase refeinements can make the difference between getting no structural information and getting a lot. So what is meant by a multiphase refinement?
In a multiphase refinement, the calculated profile is based on the sum of two (or more) profiles, each with its own set of parameters:
Each phase has its own scale factor, the value of which may be used in quantitative analysis (as will be described elsewhere). Given that there is only one diffraction pattern, then only one value for the weighted-profile R-factor is possible in a multiphase refinement. It is possible to calculate individual intensity R factors. However, one note of warning is that these are not very satisfactory for minor phases due to the lack of reliable statistical weights.
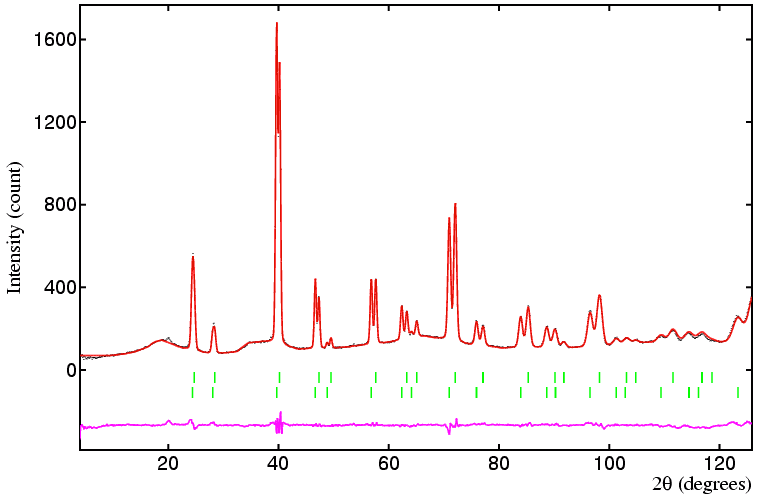
Common examples of multiphase refinement are for impurities such as ice (due to wet samples), and solid nitrogen (due to air condensation at liquid helium temperatures). These are examples of the of multiphase refinements that could be avoided at the experimental stage. An example of genuine multiphase behaviour is provided by the uranium/cerium oxide system as discussed earlier. On cooling a single phase sample of U0.4Ce0.6O2-y, two cubic patterns appear, both with space-group symmetry Fm-3m, due to phase separation into stoichiometric and non-stoichiometric oxides:
For the Rietveld refinement of the two phases, the following parameters were refined for each phase:
Stoichiometric Phase
| Scale factor, c | = | 0.023(2) |
| Lattice parameter, a | = | 5.4324(3) Å |
| U/Ce temperature factor, B(iso) | = | 0.16(3) Å2 |
| O temperature factor, B(iso) | = | 0.37(3) Å2 |
Non-Stoichiometric Phase
| Scale factor, c | = | 0.033(4) |
| Lattice parameter, a | = | 5.5054(3) Å |
| U/Ce temperature factor, B(iso) | = | 0.66(5) Å2 |
| O temperature factor, B(iso) | = | 1.98(5) Å2 |
| O site occupation number, N | = | 7.52(8) |
Both Phases
| 2θ zero error | ||
| Peak width parameters, U,V,W | = | 2.09(6)°2, −1.72(6)°2, 0.54(2)°2 |
| Pseudo-Voigt parameter, η | = | 0.17(1) |

Several points can be made concerning this refinement. The most important of these concerns the use of appropriate constraints; although in principle both phases could have different peak widths in this instance they do not, so the use of identical (tied) values for UVW for both phases is appropriate, and a particularly useful constraint given the severe overlap of all low-angle reflections. Contrast this with the use of individual B values in each phase: it may tempting to say, for example, that the oxygen anions in each phase will have the same B value, but it is clear from the refinement that they do not. (The reason is that the missing anions in the non-stoichiometric phases results in a very slight shift of both cations and ions off their ideal octahedral and tetrahedral sites. In other words there is a slight static disorder, which can be compensated for by larger B values.) When the B values are constrained to be the same between phases, the weighted-profile R-factor increases to 12.7%.
One constraint that might be considered, as least in theory, is to fix the total oxygen content to that derived from the single phase data shown earlier. This constraint, which can only be applied once the scale factors have been refined, gives a weighted-profile R-factor of 7.0%, but with one less parameter.
The uranium/cerium oxide system provides a very simple example of a phase transition. This brings us to the subject of phase transitions and powder diffraction.
| © Copyright 1997-2006. Birkbeck College, University of London. | Author(s): Jeremy Karl Cockcroft |