 |
Temperature
II. High |
 |
Temperature
II. High |
High
High temperature devices are extremely varied in size, cost and complexity; the major powder diffractometer manufacturers provide various "off the shelf" versions (up to about 1500°C) and will often negotiate with a user/buyer some degree of individual customisation. Also many powder diffractionists have devised their own versions, particularly where highly specialised sample environments are involved. The heating mechanism is usually based on one of the following principles:
| • electrical heating: | - radiative (through vacuum environment); |
| - convection (through inert or reactive gas environment); | |
| - conduction (through ceramic support for specimen); | |
| • laser heating | - radiative (see the next section on high pressure); |
| • micro-wave heating | - radiative. |
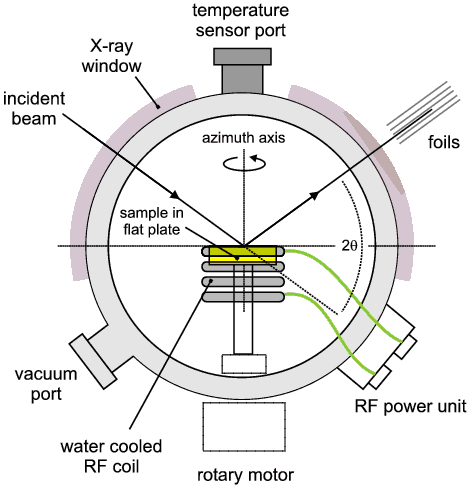
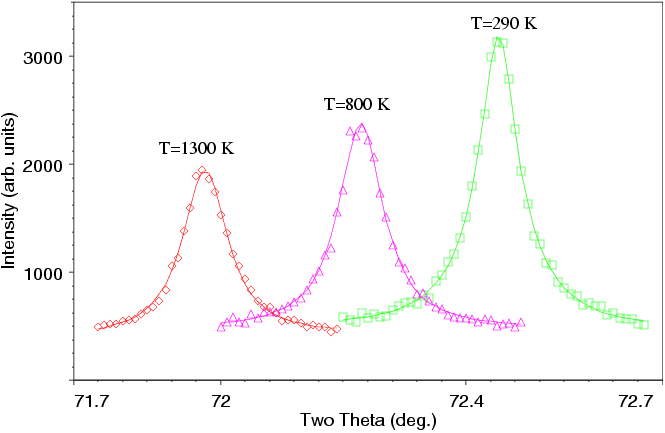
There is an enormous literature on the behaviour of materials at high temperature as evinced from high temperature powder diffraction. The wide interests span expansion coefficients, devising equations of state and establishing phase diagrams, reaction and catalysis chemistry, synthesis of materials, curiosity etc. We give just one simple example of the use of micro-wave heating to study the lattice expansion of tungsten by monitoring the 321 diffraction peak at a wavelength of 1.0 Å. Crucially the diffractometer uses the multiple foil arrangement (below) first discussed on the fourth session (Synchrotron Powder Diffraction) of this course.

The multiple foil arrangement is particularly appropriate for this type of study since the sample moves as it expands and, in the absence of foils, the diffracting regions of the sample will go off-axis leading to errors in the 2θ angle; thus the experimenter will not be sure whether the determined expansion all truly comes from the sample or whether some is false expansion arising from the sample movement. The multiple foil arrangement effectively accepts only diffracted photons from the parts of the sample lying on the diffractometer axis. A detailed expansion study would collect data at small temperature intervals; the following figure just shows the tungsten 321 peak at three temperatures; you might like to think about what information this can give you.
 |
| Data collected on station 2.3 of the SRS, by courtesy of Dr. C.C.Tang |
|
© Copyright 1997-2006.
Birkbeck College, University of London.
|
Author(s):
Paul Barnes Simon Jacques Martin Vickers Chiu Chung Tang |