 |
Whole Pattern Fitting
I. Pawley Method |
|
|
Whole Pattern Fitting
I. Pawley Method |
Pawley Method
In order to solve a structure from powder data it is necessary to extract as many hkl and intensity values as possible from the data set. Until the 1980s, this wasn't feasible due to the overlapping nature of the peaks in the powder diffraction profile. However, with the development of high-speed computers with large memories and high-resolution diffractometers, pattern decomposition became a viable and important part of the analysis of powder data. All the methods use pattern decomposition rather than deconvolution because the exact peak-width function is not known a priori, but in effect the end result is similar. There are two methods that are in common usage at the present time. The first is due Pawley (1980) and the second is due to LeBail (1988).
Pawley suggested that angle-dispersive powder diffraction profiles could be fitted with only the following parameters:
In terms of a least-squares minimization procedure, this requires typically a (10+N) × (10+N) square matrix, where N is the number of symmetry-independent reflections generated for the 2θ range covered by the data. So for 200 reflections, this will require computer memory of only approximately 170 kbytes, but for 2000 reflections, the memory required for the matrix alone will be 16 Mbytes.
As described, the method has two problems, the first of which is illustrated by the following set of figures, in which the observed profile (or total count) is shown in red and the contributions of two peaks A and B are shown in cyan and green, respectively:

In this first figure, the two peaks are fairly well separated and there is little correlation between their intensity values as obtained by least-squares fitting of the observed profile.
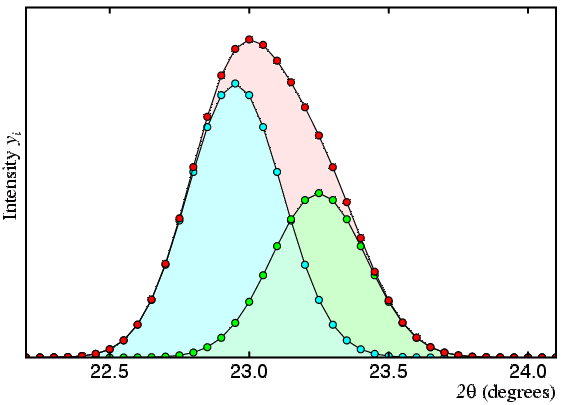
In the second figure, the two peaks are now closer together and any peak intensity values derived from the profile will start to show correlation.

In the third figure, the two peaks are now so close together that any least-squares procedure risks producing incorrect intensity values for the two peaks. The cyan and green peaks have an actual intensity ratio of 5 to 3, but the smallest of errors in either the observed profile shown in red or the peak profile used to described the two peaks shown in cyan and green could lead to ratios such as 10 to 1, say, or even 1 to 10 (or worse) for their fitted intensity ratio.
Thus, there is a large correlation in the values of I(hkl) for peaks that are nearly coincident with the correlation rising to 100% for peaks that have the same d spacing within the limits of resolution of the data. Large correlations lead to unstable (and ultimately singular) least-squares matrices. An extreme example of the problem of near 100% correlation is illustrated in the final figure below:

Here the observed profile is shown fitted to two peaks, one of which is much bigger than the total observed intensity, and the other of which is negative. There is nothing in the least-squares procedure that forces the peaks to have positive intensity, despite the fact that I(hkl) must be positive to be meaningful.
Pawley reduced the correlations by introducing both constraints and restraints into the least-squares procedure: as the difference between the calculated 2θ values of two adjacent peaks approaches zero, the following equality is applied:
When the Δ2θ is less than, say, the step size, this information is introduced as a hard constraint in the refinement procedure: when the value is larger, it is used as a soft restraint. While the above equality attempts to avert the problem of negative intensities, it may not prevent them completely, and so negative I(hkl) values may occasionally be obtained in the output from programs that use the method as described. An alternative approach is to base the refinement on |F| instead of I. This forces the peak intensities to have positive values only, but computer programs that use this method take much longer to run.
A second problem concerns the wasted array space and computer time used to fill it. Most of the least-squares matrix is filled with zeros when the value of Nhkl is large. This is because the matrix contains many terms for each point i in the profile yi of the type:
| Σ | dyi — dIj |
× | dyi — dIk |
|
| i | ||||
The above is really a computer science problem and not one intrinsic to the method, so though it was in the 1980's when computers were slower and more memory limited than now. One solution to the above problem is to reduce the matrix to smaller units by block diagonalization, in which only the elements close to the diagonal of the matrix are considered for the lower-value d spacings.
As a consequence of these two problems with the Pawley, the LeBail method of whole pattern fitting was developed. The latter led to an enormous increase in the use of whole pattern fitting and, moreover, stimulated improvements in the Pawley method itself.
| © Copyright 1997-2006. Birkbeck College, University of London. | Author(s): Jeremy Karl Cockcroft |