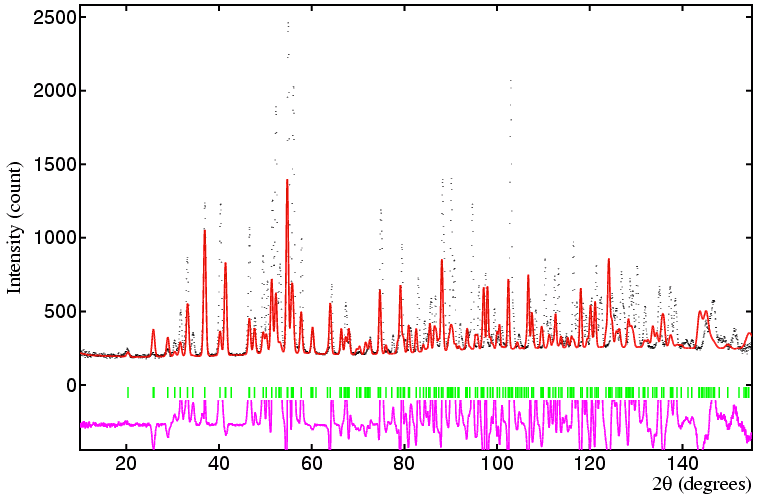

As in Figure 1, the black dots show the observed diffraction profile; the green vertical tick marks show calculated reflection positions; and the red line shows the calculated profile. The clipped magenta-coloured line at the bottom of the plot shows the difference plot between observed and calculated profiles, yi(obs)-yi(calc). An expanded region of this plot (53.5° to 65.5°) is shown in Figure 2a.
| © Copyright 1997-2006. Birkbeck College, University of London. | Author(s): Jeremy Karl Cockcroft |